Where Volume Profile shows you where volume traded, Delta Axis shows you where the real commitment was. It separates who was driving price from who was reactive.
What you're reading
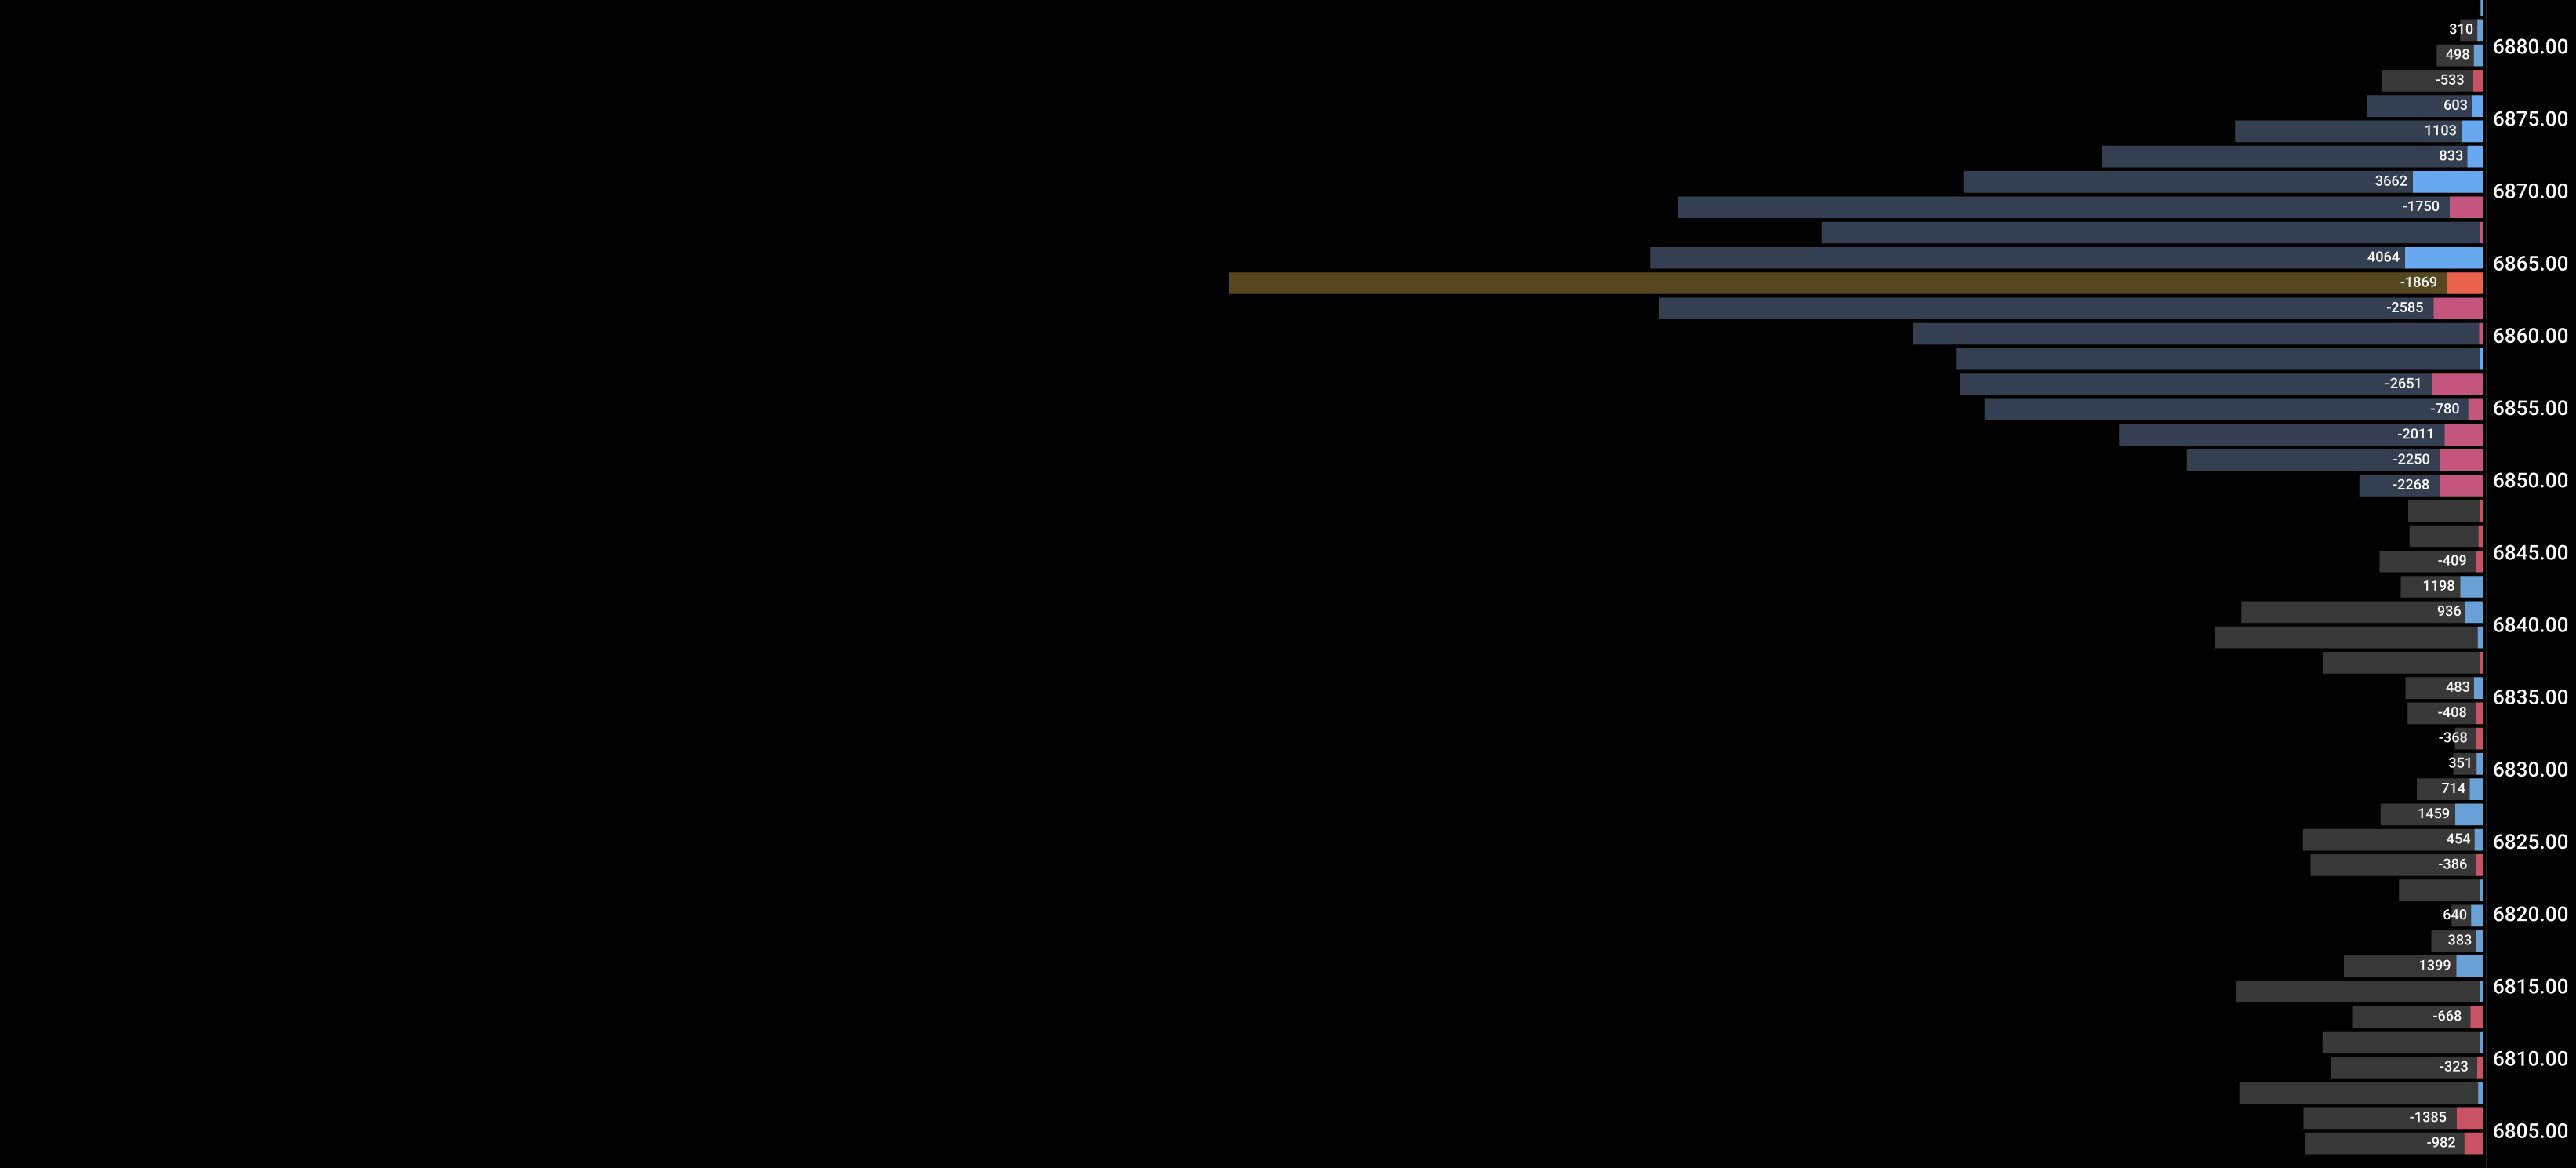
Delta Axis plots a right-anchored profile of net delta (ask − bid) per price level across the session. This is the distribution of committed buying and selling — not just volume, but directional aggression.
Delta POC — the price with the highest absolute net delta for the session. The level where the most committed directional pressure occurred. Often a magnet or a key reaction level post-session.
Delta Value Area — the 70% delta concentration zone. Similar role to VP Value Area but filtered for directional commitment only.
Teal profile bars — levels with net buying (ask > bid). Buyers were committed here.
Magenta profile bars — levels with net selling (bid > ask). Sellers were committed here.
Delta POC vs Price POC divergence — if Delta POC is at a very different level than Volume Profile POC, there's a hidden bias story in the session. The price was accepted somewhere but committed flow was somewhere else.
Confluence — what to stack
Delta Axis signal
Add this indicator
Result
Delta POC = VP POC (same level)
Flow Volume Profile
Maximum confluence fair value — strongest mean-reversion zone
Delta POC far above VP POC
Flow CVD — CVD also bullish?
Bullish session bias confirmed — buy pullbacks to delta POC
Delta POC far below price
Flow Footprint — divergence visible on top bars?
Hidden bearish commitment — watch for distribution
Strong teal at a prior supply zone
Flow Imbalance — zone still active?
Zone broken by committed buyers — momentum continuation
Delta Value Area very narrow
Flow Volume Profile — thin volume area matches?
Low commitment session — range-bound, reduce size
Trade scenarios
Session bias read — knowing the day's directional lean before placing a trade
SetupMid-session (11:00–11:30 ET). Delta Axis profile is building. You need to know if this is a buyer-controlled or seller-controlled session.
TriggerDelta Axis POC is clearly above current price — buying pressure concentrated above where price is. OR Delta POC is at the high — distribution in progress.
ConfirmCVD trend matches: rising if Delta POC is bullish, declining if bearish. Volume Profile POC close to Delta POC = balanced session confirmation.
InvalidateDelta Axis profile is nearly symmetrical (equal teal/magenta at all levels) — no directional commitment. Treat the session as range-bound, not trending.
Key settings
Session preset: US RTH (9:30–16:15 ET) is primary. Use Overnight preset if you trade globex sessions.
Combined mode: Useful on zoomed-out charts — merges multi-session delta into one profile for context across days.
RTH auto-reset: Keep ON. Ensures each RTH session starts fresh — prior day's delta doesn't contaminate your current read.
Value Area %: Keep at 70% to match Volume Profile standard. This lets you compare the two profiles easily.
Quick FAQ
What's the difference between Delta Axis and Volume Profile? VP shows where volume traded (all prints, passive + aggressive). Delta Axis shows where net directional aggression was. VP = acceptance. Delta Axis = commitment.
Does it need tick data? Yes. Net delta per price level requires tick-level volume data.