Stacked aggression leaves a mark. Flow Imbalance finds where the market committed hard to one direction and projects those zones forward until they're invalidated by price.
What you're reading
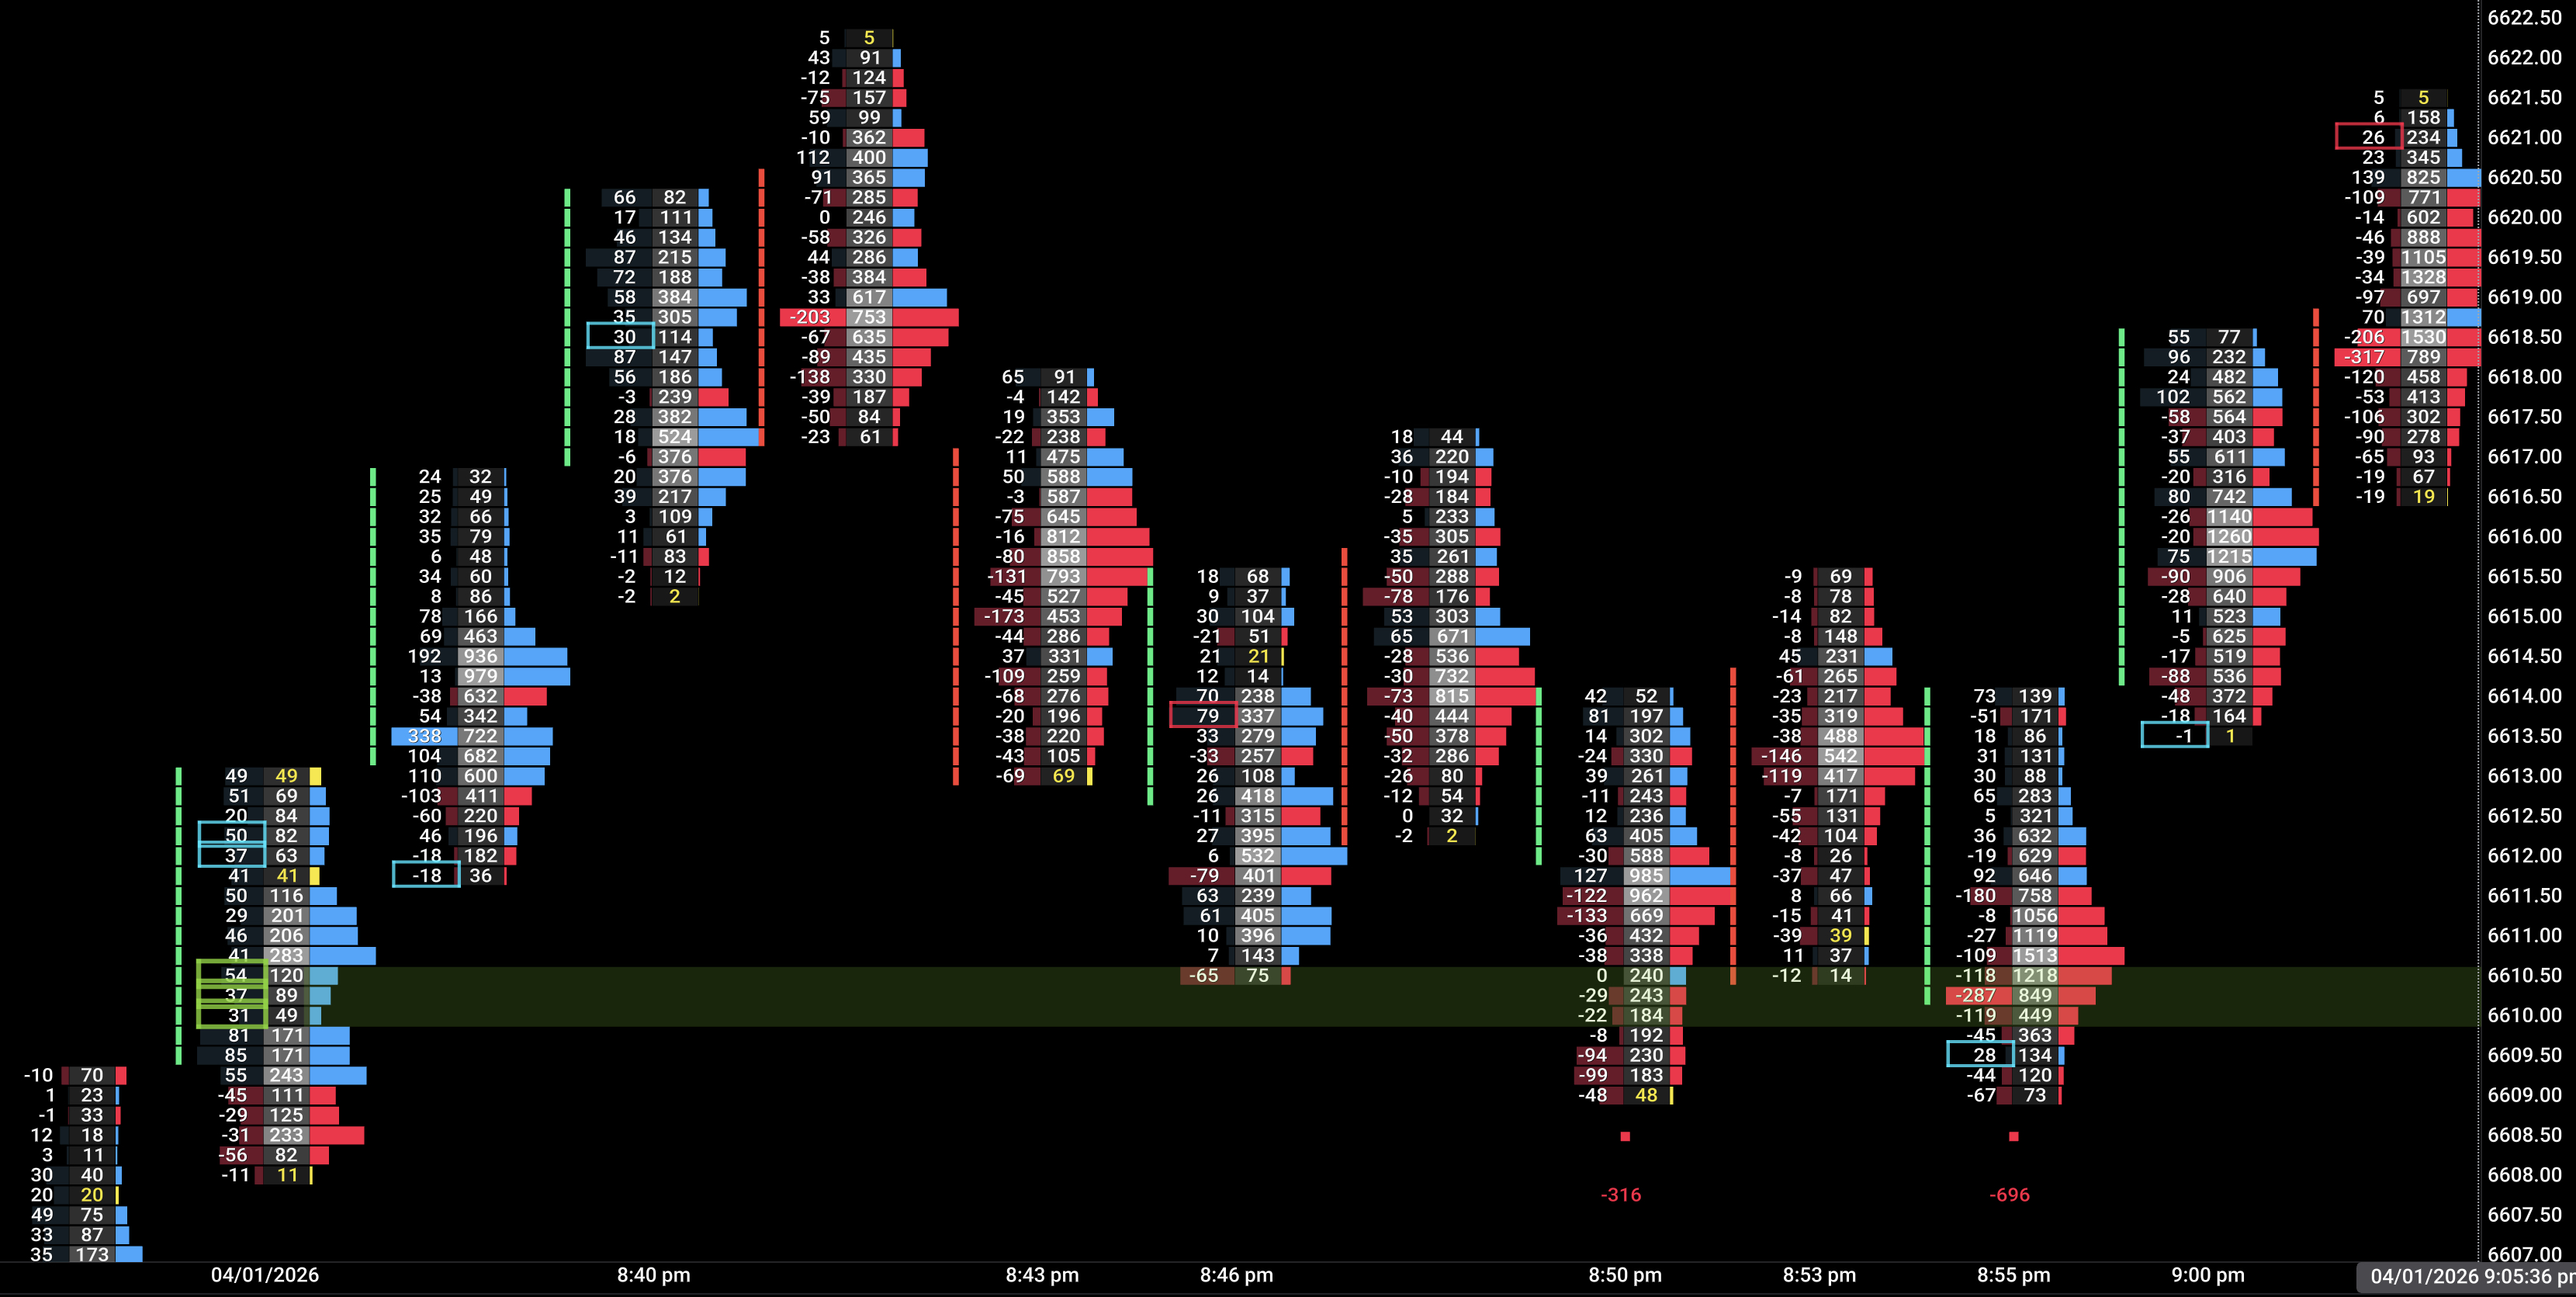
An imbalance occurs when the ask volume on one level is significantly larger than the bid on the level directly above it (or vice versa). The ratio and minimum volume thresholds are configurable. When multiple imbalances stack consecutively on the same side, it's a stacked imbalance — a sign of true institutional aggression, not random noise.
Teal zone (demand) — stacked ask-side imbalances. Buyers were aggressive through these levels. Price often revisits and finds support.
Magenta zone (supply) — stacked bid-side imbalances. Sellers were aggressive. Price often reacts and finds resistance.
Zone active — the zone remains projected forward until price closes decisively through it.
Zone invalidated — a decisive close through the zone removes it. The market acknowledged and absorbed or rejected it.
Diagonal imbalance — a single-level imbalance between adjacent price levels. Weaker than stacked but still informative context.
Confluence — what to stack
Imbalance signal
Add this indicator
Result
Active demand zone (teal)
Flow Big Orders — teal bubble appearing at zone boundary
Strong long entry trigger
Price returning to demand zone
Flow Footprint — is absorption happening at the zone?
Absorption = confirm the zone is holding
Supply zone (magenta) above ORH
Flow ORB — ORH level aligning with supply zone top
Double resistance — ideal fading zone
Zone not yet tested
Flow Volume Profile — zone inside prior session VA
Higher probability zone holds
Price breaking through demand zone
Flow CVD — CVD also declining through break
Zone invalidated, don't buy the break
Trade scenarios
Demand zone re-test long — the classic pullback
SetupA teal stacked imbalance zone formed on a prior bullish move and remains active. Price pulls back toward the zone during a consolidation.
TriggerPrice touches the upper boundary of the demand zone. First touch of an untested zone.
ConfirmFootprint shows absorption at the zone (high volume, near-zero or positive delta). A teal Big Orders bubble appears at the zone level. CVD stabilizes or ticks up.
InvalidateA bar closes below the full zone with negative delta. The zone is cleared — do not trade back into the broken demand.
Supply zone fade — shorting into stacked aggression
SetupA magenta stacked supply zone is active above the current price from a prior aggressive sell-off. Price is rallying back up toward the zone.
TriggerPrice enters the zone. The rally stalls. A Footprint bar shows high ask volume at the zone with negative delta — selling pressure at the zone.
ConfirmA magenta Big Orders bubble at the zone level. CVD rolling over. Delta Grid shows increasing negative delta% on the stall bars.
InvalidateA strong bullish bar closes above the zone's upper boundary with positive delta and strong CVD thrust. Zone is cleared — abandon the fade.
Zone cluster — two zones sandwiching price
SetupA demand zone is below current price and a supply zone is above. Price is rangebound between them.
TriggerPrice approaches either zone. The first zone touched is the entry candidate, the opposite zone is the target.
ConfirmFootprint confirms absorption at the zone. Volume Profile POC is near the middle of the range (balanced market, good for zone-to-zone plays).
InvalidateEither zone is broken with conviction before your entry. Reassess — once a zone is cleared, the range structure is broken.
Key settings
Imbalance ratio — Start at 3:1 (ask vs bid on adjacent level). Lower = more zones, more noise. Higher = fewer but higher-quality zones.
Minimum volume per level — Filter out low-participation levels. ES: 50–100 contracts minimum. NQ: 20–40.
Forward projection — Keep ON. Zones are only useful if you can see them on the right edge of the chart.
Invalidation mode — "Close through zone" is the most reliable. Wicks into zones are noise, closes are facts.
Quick FAQ
Does it need footprint data? Yes for full diagonal and stacked imbalance detection. The zone rendering itself is standalone — no footprint chart needed.
How many zones is too many? If your chart has more than 4-5 active zones, your ratio threshold is probably too low. Tighten it.
Can zones stack from multiple sessions? Yes. Older zones are weaker but still valid until invalidated. Consider zone age in your weighting.