Know where the market spent time. Volume Profile maps the session's fair value zone and the extremes — making every price level meaningful before you look at a single candle.
What you're reading
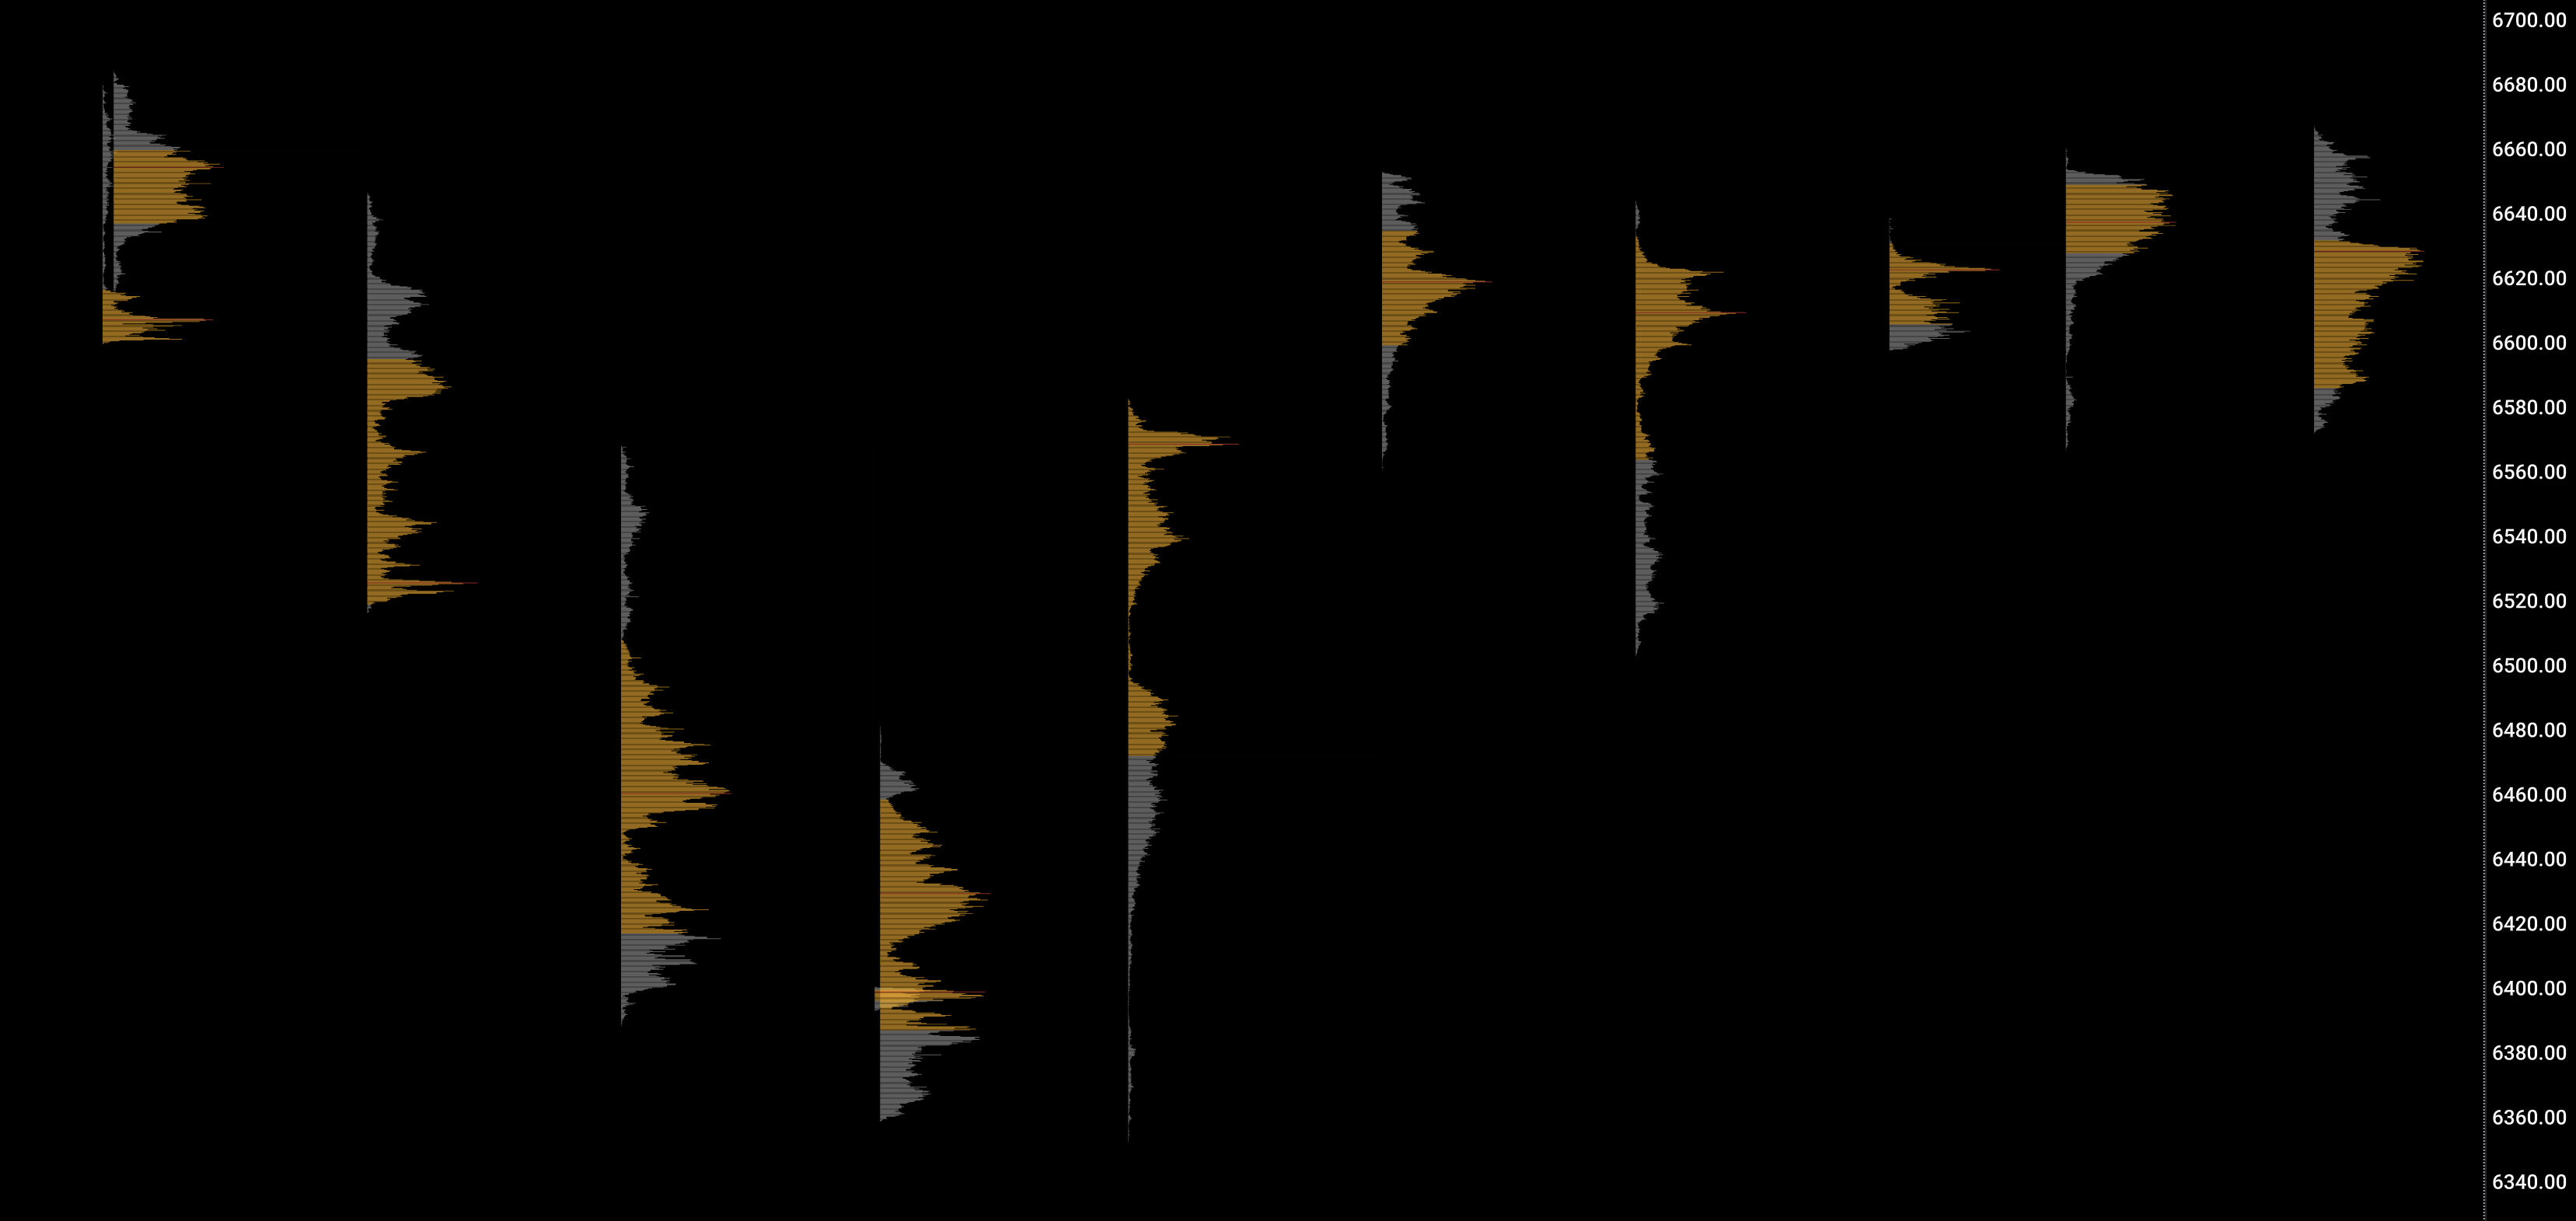
The volume profile shows the horizontal distribution of volume across price for a session. It answers: where did the market accept value? The key levels are the POC, VAH, and VAL.
POC (Point of Control) — the price with the highest traded volume. The market's fairest perceived value for the session. Acts as a magnet when price is away from it.
VAH (Value Area High) — upper boundary of the 70% volume concentration. Resistance in a balanced market. Breakout above with participation = bullish expansion.
VAL (Value Area Low) — lower boundary. Support in a balanced market. Break below with conviction = bearish expansion.
RTH vs ETH split — the RTH session (9:30–16:15 ET) shows true institutional participation. ETH (overnight) is thinner. Keeping them separate prevents overnight noise from contaminating your RTH profile.
Thin areas (low volume nodes) — areas where almost no trading happened. Price tends to move through these quickly. They're vacuum zones.
Confluence — what to stack
VP signal
Add this indicator
Result
Price at VAH with upward momentum
Flow Footprint — ask-dominant at VAH?
VAH breakout attempt — confirm with footprint
Price returning to POC
Flow VWAP — is VWAP near POC too?
Double mean-reversion magnet — high probability return
Low volume node above current price
Flow ORB — ORH aligned with low vol node?
Vacuum to TP1 — fast move likely if ORH breaks
Price at VAL holding
Flow Imbalance — active demand zone at VAL?
Double support — strong long candidate
Price below VAL with no bounce
Flow CVD — CVD declining?
Bearish expansion mode — don't buy into falling VAL
Trade scenarios
POC reversion — trading back to fair value
SetupPrice is extended away from the session POC (top or bottom of the range) after a directional move.
TriggerPrice starts reversing toward POC. First retracement bar after the extension. VWAP is also near POC.
ConfirmFootprint shows weak delta on the prior move (divergence or absorption). CVD starting to flatten. No large opposing bubbles blocking the return path.
InvalidateStrong participation on the extension continues. CVD keeps trending. Price doesn't even retrace — don't fight a committed directional session.
VAH breakout — bullish expansion entry
SetupPrice is inside the value area, testing VAH for the 2nd or 3rd time in the session.
TriggerA bar closes above VAH with strong ask-dominant footprint. CVD rising. Low volume node visible above VAH.
ConfirmTeal Big Orders bubble near VAH. Delta Grid shows high positive delta% on the break bar. Prior session VAH also below — no overhead resistance immediately.
InvalidatePrice breaks VAH but immediately reverses. Footprint absorption at VAH. This is a false break — VAH held as resistance.
Key settings
Session preset — US RTH: 9:30–16:15 ET. Primary session for ES, NQ, CL futures. Most relevant profile for execution context.
ETH/RTH split: Enable for "US Full" mode. This separates overnight from RTH volume — keeps your RTH POC clean from pre-market distortion.
Value area %: Standard is 70%. Institutional consensus level. Don't change this unless you have a specific reason.
Key level extension: Extend VAH/VAL/POC lines forward. Keeps prior session levels visible on the right edge — prior day's POC is often today's magnet.
Quick FAQ
Does it need tick data? Yes. Volume profile requires per-tick volume data from Tradovate Trader+ or higher.
How many sessions show at once? Configurable. 1–3 sessions is the usual sweet spot for execution context without visual clutter.
Prior session POC — is it useful? Yes. It's often the strongest single reference level in RTH. Price gravitates to it frequently.